No matter how hard I try, I still don't quite understand hedge funds.
According to an article in today's Economist (10/20/08), "hedge funds sold shares in VW that they did not own." From what I can tell, companies such as Morgan Stanley and Goldman Sachs and the likes might have "exposure" to VW. There is no telling, right?!
I guess if things were transparent, the general public might have a better idea of what is going on, and perhaps have a better chance of making better data-driven financial decisions. Right now, people are third-guessing. What a game the world has been playing!
From the article:
"Adam Jonas of Morgan Stanley warned clients on October 8th of the danger of playing “billionaire’s poker” by betting against Porsche."
That sounds about right.
Yes. Billionaire's Poker.
Porche and VW - Squeezy money: How Porsche fleeced hedge funds and roiled the world's financial markets
Thursday, October 30, 2008
Tuesday, October 28, 2008
Interactive Economic Graphic from NY Times: Year-over-year change in home prices through August 2008 - data from Standard & Poor's Case-shiller
Thank you Vu Nguyen, Seth Feaster, and Kevin Quealy for the elegant interactive graphic of the change in home prices in 20 cities in the US from January '01 through August '08!
Related:
For more information about housing price changes and finance topics, do a search on the Seeking Alpha website. Also check out Seeking Alpha's Breaking News page, for "real time commentary on the market, with links to key sources".
Seeking Alpha is the child of David Jackson, a former tech research analyst for Morgan Stanley. I plan on spending some time exploring the site. The nice thing about this site is that the articles are arranged a tagged so it is easy to find the information you need. The articles often contain lots of links, so you don't have to waste too much time digging deeper into topics of interest.
Below is a sample of some of the graphics related to US home prices via Seeking Alpha, in no particular order:


Sunday, October 26, 2008
Oil-rich Gulf, Kuwait, Bahrain, Oman, Quatar, Dubai, & Saudi markets fall in reaction to current global crisis...
A "hot of the press" article from the Wall Street Journal, written by Margaret Coker and Chip Cummins, gives some insight about the impact of the current global crisis on the mid-east economy, including places such as Dubai. Along with the price of crude oil, equity values have fallen.
Financial Storm Hits Gulf October 27, 2008
Image from the Wall Street Journal
![[Tumbling Markets]](http://s.wsj.net/public/resources/images/P1-AN443B_GULF_NS_20081026203602.gif)
A Primer on Credit Default Insurance, and more, from the New York Times
Via Visualizing Economics:
Credit Swaps Insurance Market: 2000-2007
New York Times Graphic: 2/17/08

New York Times Graphic: 2/17/08

February 17, 2008 (Gretchen Morgenson, NY Times)
Arcane Market is Next to Face Big Credit Test
February 27, 2008
Small and Midsize U.S. Banks Beginning to Struggle in Credit Crisis
"..But the breadth and depth of the current troubles have caught bank executives by surprise."
Related NY Times Graphic:

2007
Who's Watching Your Money? (Robert M. Morgenthau, April 30, 2007, NY Times Op Ed)
"...the United States Supreme Court upheld an ill-advised regulation issued by the Office of the Comptroller of the Currency, exempting subsidiaries of national banks from regulation by state banking authorities. This regulation makes the comptroller the exclusive regulator of these banks, even though the office is financed almost entirely by the banks it oversees...."
2005
A Hands-Off Policy on Mortgage Loans (Edmund L. Andrews, NY Times Business, July 14, 2005)
2005 Related NY Times Graphic:

2005
Betting on Rates (NY Times Graphic)
Credit Swaps Insurance Market: 2000-2007
New York Times Graphic: 2/17/08
New York Times Graphic: 2/17/08
February 17, 2008 (Gretchen Morgenson, NY Times)
Arcane Market is Next to Face Big Credit Test
"The market for these securities is enormous. Since 2000, it has ballooned from $900 billion to more than $45.5 trillion — roughly twice the size of the entire United States stock market."
"No one knows how troubled the credit swaps market is, because, like the now-distressed market for subprime mortgage securities, it is unregulated. But because swaps have proliferated so rapidly, experts say that a hiccup in this market could set off a chain reaction of losses at financial institutions, making it even harder for borrowers to get loans that grease economic activity."February 27, 2008
Small and Midsize U.S. Banks Beginning to Struggle in Credit Crisis
"..But the breadth and depth of the current troubles have caught bank executives by surprise."
Related NY Times Graphic:
2007
Who's Watching Your Money? (Robert M. Morgenthau, April 30, 2007, NY Times Op Ed)
"...the United States Supreme Court upheld an ill-advised regulation issued by the Office of the Comptroller of the Currency, exempting subsidiaries of national banks from regulation by state banking authorities. This regulation makes the comptroller the exclusive regulator of these banks, even though the office is financed almost entirely by the banks it oversees...."
2005
A Hands-Off Policy on Mortgage Loans (Edmund L. Andrews, NY Times Business, July 14, 2005)
"The reason is that federal banking regulators, from the Federal Reserve to the Office of the Comptroller of the Currency, have been reluctant to back up their words with specific actions. For even as they urge caution, officials here are loath to stand in the way of new methods of extending credit."
""We don't want to stifle financial innovation," said Steve Fritts, associate director for risk management policy at the Federal Deposit Insurance Corporation. "We have the most vibrant housing and housing-finance market in the world, and there is a lot of innovation. Normally, we think that if consumers have a lot of choice, that's a good thing.""
"...Despite their hands-off approach, some regulators are worried that banks and other mortgage lenders may not have properly judged the risks to themselves. They warn that speculative buying has increased, with many people hoping to quickly resell houses and condominiums before the construction is even finished..."2005 Related NY Times Graphic:
2005
Betting on Rates (NY Times Graphic)
Saturday, October 25, 2008
Massive Declines All Around the World; Wall Street Journal Video - Analysis of World
Is it impossible for experts to model the current state of the world economy?
For a few insights about the current global economic situation, take a look at the video analysis with Andy Jordan and Tom Lauricella from the Wall Street Journal below.
Are there glimmers of hope in this massive decline of global markets? How can we really know?
Market Mush
Related
WSJ Interactive Graphic of 10/24/08 Market Dynamics:
Tough Session: Stock declines started in Asia and quickly spread as markets opened for trading around the world
WSJ Article -10/25/08:
Fresh Tumult as Signs of Recession go Global
(Kelly Evans, Joellen Perry,Yumiko Ono and John Lyons)
"In rich countries and poor countries alike, markets are plunging, companies are scrambling for credit and cutting their growth plans and consumers are keeping cash in their pockets. The U.S. and some governments in Europe and Asia are spending heavily to stanch the problems in markets and Main Streets globally, but the attempts have not halted the damage."
Tuesday, October 21, 2008
Economic Odds and Ends: Stock Market Panorama; Banking and Children;
Here are a few odds and ends regarding the economy:
Ambient information systems - a real-time data panorama of the stock market:

Real-time data panoramas: "Once the stock market opens, our 3D simulation comes to life & people start 'breathing' business information" via Bashiba.com "BASHIBA Panorama exploits the visual perceptual capabilities of the human brain. It harnesses untapped brain power."
Children and the current economic crisis:

Banking and Saving with Your Child (Video via Knowledge Essentials)
(from Knowledge Essentials on BlipTV) "Tough economic times are everywhere. How do you explain what the economy is to your child and then parlay that into help with your household budget? Check this out to see."
Ambient information systems - a real-time data panorama of the stock market:
Real-time data panoramas: "Once the stock market opens, our 3D simulation comes to life & people start 'breathing' business information" via Bashiba.com "BASHIBA Panorama exploits the visual perceptual capabilities of the human brain. It harnesses untapped brain power."
Children and the current economic crisis:
Banking and Saving with Your Child (Video via Knowledge Essentials)
(from Knowledge Essentials on BlipTV) "Tough economic times are everywhere. How do you explain what the economy is to your child and then parlay that into help with your household budget? Check this out to see."
Sunday, October 19, 2008
Economic Sounds and Sights as Interactive Timeline in Dipity
 "We unlocked “Dipity 2.0″ today with one simple goal: letting you follow updates from the people and topics you care about, and have fun doing it.
The new Dipity organizes updates from sites like YouTube, WordPress, Twitter, and 7500 news sites into “channels” on our interactive timeline.
Dipity is the best place to go to catch up on your online world.
You can create your personal channel to broadcast updates to your friends, and can start a channel about anything from Darfur to Dave Mathews in just a few seconds. Start a channel is super-simple fast new options:
* Web Search: Enter a keyword and we’ll scour the web for the most popular content
* Feeds: Drop in an RSS feed and we’ll take it from there.
* Fresh: Start fresh and update with links, video, images and more."
Interactive economic timelines in Dippity
I'm still searching for examples of interactive timelines related to economics, finance, economic history, and the current economic crisis. I visited the Dipity website, and found a few interesting timelines:
An Interactive Timeline of the Current Economic Crisis, from Dipity
The Financial Crisis: A shocking series of events that forever changed the financial markets, as reported by Fortune magazine. (Created on Dippity by cwood)
Note: Contents in the Dipity format can be viewed as an interactive timeline, a flipbook, a list, or a map.
FelixLowe
Here is a static timeline:
Timeline of Economic Turmoil Virgin Media, September 30, 2008
"The Last God of Central Bank Still Standing": Paul Volcker on Charlie Rose
Ryan Lanham shared the following link, along with his comment, "Fascinating, long form discussion between Charlie Rose and Paul Volcker. Yet another example of using television to elucidate ideas, rather than yelling and bumper sticker foolishness."
Paul Volker on Charlie Rose, via Big Picture
October 9, 2008
http://www.charlierose.com/guests/paul-volcker
The comments section on the Charlie Rose website is worth reading.
Related:
I found this link to the Political Irony blog:
US Electoral Maps before and after Great Depression
Original source: 270toWin:
"270towin.com is an interactive Electoral College map for 2008 and a history of Presidential elections in the United States. Since electoral votes are generally allocated on an "all or none" basis by state, the election of a U.S President is about winning the popular vote in enough states to achieve 270 electoral votes, a majority of the 538 that are available. It is not about getting the most overall popular votes, as we saw in the 2000 election, when the electoral vote winner (Bush) and the popular vote winner (Gore) were different."
FYI: I'd like to gather more information about hedge funds for an upcoming post. Here is some additional food for thought, via Ryan Lanham:
"I fear the hedge fund unwind is even more dangerous, less transparent, and more immediate of a crisis for the markets than real estate."
Tuesday, October 14, 2008
Ten Songs from Tough Economic Times, Ten Songs about the Economy, Demand, Supply Rap, and Economic Songs for Kids
The market went up on Monday, the U.S. government's latest economic strategies were debated, the market was so-so on Tuesday, and I am still struggling to figure things out. I don't have any profound insights to share at the moment....
In the meantime, here are links to some "Economic Sounds"....
Ten Songs from Tough Economic Times - Ken Oliver's post on the Music Matters blog
"Demand, Supply" Rap, by Rhythm, Rhyme, Results
Top 10 Songs about the Economy - by Wade Tatangelo, of Tampa Calling, Creative Loafing
Economic Songs (For Kids)
The following songs are from the KidsEcon website. The links are to lyrics set to the tune of popular songs, such as "If you are happy and you know it, clap your hands".
I especially liked these songs, in light of our current circumstances, both set to "The Farmer in the Dell":
The Handy Dandy Guide Helps Me Decide!
The Supply and Demand Song
Link from Visualizing Economics: Flashback Economy/Prices
I came across a link on the Visualizing Economics blog to the Flashback website , where you can find information about the economy as it was from the 1960's to the present.
What we really need now is "flash-forward" website!
What we really need now is "flash-forward" website!
Monday, October 13, 2008
Wall Street Journal and New York Times Online: Treasure Troves for Economic and Financial Info
The on-line versions of the Wall Street Journal and the New York Times are great resources for information, current and historical, about economics and finance. In addition to what you find in the print, you will find a variety of interactive charts, photos, and video clips.
Here are few interesting links:
(Note: Some videos may contain ads.)
Wall Street Journal
Wall Street Journal's Interactive Graphics (This site contains interactive graphics about business, the economy, finance, politics, and more.)
Kashkari Gives 'Comprehensive Update' on Rescue Plan (full text from Interim Assistant Secretary for Finance)
Tumbling Stocks, Plunging Currencies (Interactive map depicting information about the major stock index and currency of various countries over the past three months.)
Bears That Won't Go Away (Chart)
What History Tells Us About the Market (10/11/08 -Article with photos)
IMF Pledges Support, but Is Short on Details (10/12/08 - Video; Analysis by WSJ Reporter Bob Davis)
New York Times
Podcast: Weekend Business (10/10/08)
Kashkari Details Rescue Plan (10/13/2008) (CNBC Video, linked from NYT online)
Echoes of a Dismal Past (Video)
How This Bear Market Compares (interactive chart, depicts losses and in length, over the past 80 years)
Credit Crisis Indicators ( interactive chart, depicts 3-Month Treasury, Libor, Ted, Paper, & Bonds)
Friday, October 10, 2008
Business Week: "They Warned Us About the Mortgage Crisis"
A recent article in Business Week explains how some state officials were concerned about lending practices, and why their concerns went unheeded several years ago:
"They Warned Us About the Mortgage Crisis"
10/09/2008 by Robert Berner and Brian Grow
FYI: Business Week's Learning Center provides a good overview of stock market and investing basics, including definition of terms.
"They Warned Us About the Mortgage Crisis"
10/09/2008 by Robert Berner and Brian Grow
FYI: Business Week's Learning Center provides a good overview of stock market and investing basics, including definition of terms.
NY Times Series "The Reckoning: The Risk in Hindsight"
As a public school employee, my investment knowledge, until the past few weeks, has been limited to my understanding of my low-risk 401K and 403-b funds.
Derivatives? Hedge funds? Credit Derivatives? Short selling? Futures Contracts? Why should I worry about all of that! Like many other people, I was happy in my ignorance.
Here are a few links that I found useful in my fast-track education in finance and economics:
The New York Times Online is full of articles and video clips exploring the causes of the financial crisis:
Video: Examining the Financial Crisis
Video Timeline: Five Weeks of Financial TurmoilVideo: How Fannie Mae's Problems Lead to the Country's Financial Crisis
The Credit Crisis-The Essentials
AIG: Behind Insurer’s Crisis, Blind Eye to a Web of Risk
Taking a Hard New Look at Greenspan Legacy

NY Times Multimedia Graphic: Growth of a Complex Market
Interactive Graphic: Credit Crisis Indicators
More to come!
Reference:
Investopedia
Derivatives? Hedge funds? Credit Derivatives? Short selling? Futures Contracts? Why should I worry about all of that! Like many other people, I was happy in my ignorance.
Here are a few links that I found useful in my fast-track education in finance and economics:
The New York Times Online is full of articles and video clips exploring the causes of the financial crisis:
Video: Examining the Financial Crisis
Video Timeline: Five Weeks of Financial TurmoilVideo: How Fannie Mae's Problems Lead to the Country's Financial Crisis
The Credit Crisis-The Essentials
AIG: Behind Insurer’s Crisis, Blind Eye to a Web of Risk
Taking a Hard New Look at Greenspan Legacy
NY Times Multimedia Graphic: Growth of a Complex Market
Interactive Graphic: Credit Crisis Indicators
More to come!
Reference:
Investopedia
Links to Data and Information Visualization Resources for Economics, Finance, and the Current Crisis
If you are interested in learning more about data and information visualization, in light of our current economic crisis, take the time to explore the following links. This list is just a start!
(Warning: A few of the links have a political slant, in one way or another.)
Wikipedia: Visual Analytics
Robert Kosara: Eager Eyes
Nathan Yau: Flowing Data
Nathan Yau's post: Great Data Visualization Tells a Great Story
IBM: Many Eyes
"Many Eyes is a bet on the power of human visual intelligence to find patterns. Our goal is to "democratize visualization and to enable a new social kind of data analysis."
Visual Complexity
Meryl.Net: 175+ Data and Information Visualization Examples and Resources
Death and Taxes 2009 : A Visual Guide to Where Your Federal Tax Dollars Go (from WallStats
: The Art of Information)
Aaron Schiff: 26econ.com
Aaron Schiff's post: Building Interactive Economic Models with Excel
Aaron Schiff's Economic Blog Directory and Rankings
They Rule: Create maps of the interlocking directories of the top US companies from 2004
Hans Rosling and GapMinder
Gapminder World Blog
Hans Roslinger's Gapminder Ted Talk video
Barry Ritholtz: The Big Picture: Macro Perspective on the Capital Markets, Economy, Geopolitics, Technology, and Digital Media
Follow the Oil Money (Interactive chart that provides views of companies, politicians, and relationships)
Presidential Watch 08: A Map of the Political Blogosphere
Enron E-Mail Explorer
Economic Data Resources
Economic Indicators.Gov
Economic Statistics (Whitehouse)
US Bureau of Economic Analysis, U.S. Department of Commerce
The World Bank
The International Money Fund Data and Statistics

IMF Data Animation, October 2008
(Warning: A few of the links have a political slant, in one way or another.)
Wikipedia: Visual Analytics
Robert Kosara: Eager Eyes
Nathan Yau: Flowing Data
Nathan Yau's post: Great Data Visualization Tells a Great Story
IBM: Many Eyes
"Many Eyes is a bet on the power of human visual intelligence to find patterns. Our goal is to "democratize visualization and to enable a new social kind of data analysis."
Visual Complexity
Meryl.Net: 175+ Data and Information Visualization Examples and Resources
Death and Taxes 2009 : A Visual Guide to Where Your Federal Tax Dollars Go (from WallStats
: The Art of Information)
Aaron Schiff: 26econ.com
Aaron Schiff's post: Building Interactive Economic Models with Excel
Aaron Schiff's Economic Blog Directory and Rankings
They Rule: Create maps of the interlocking directories of the top US companies from 2004
Hans Rosling and GapMinder
Gapminder World Blog
Hans Roslinger's Gapminder Ted Talk video
Barry Ritholtz: The Big Picture: Macro Perspective on the Capital Markets, Economy, Geopolitics, Technology, and Digital Media
Follow the Oil Money (Interactive chart that provides views of companies, politicians, and relationships)
Presidential Watch 08: A Map of the Political Blogosphere
Enron E-Mail Explorer
Economic Data Resources
Economic Indicators.Gov
Economic Statistics (Whitehouse)
US Bureau of Economic Analysis, U.S. Department of Commerce
The World Bank
The International Money Fund Data and Statistics
IMF Data Animation, October 2008
Catherine Mulbrandon's Visualizing Economics Blog
In my quest to become better-informed in topics related to finance and economics, I came across the Visualizing Economics blog. The author/designer of this blog is Catherine Mulbrandon. She has a degree in economics from the University of Chicago, and a graduate degree in Interaction Design from Carnegie Mellon, focusing on information and interaction design.
Not until I took a class in information visualization did I fully appreciate the importance of this way of understanding, interpreting, and sharing data.
Catherine's "Manifesto" explains why this is important:
Not until I took a class in information visualization did I fully appreciate the importance of this way of understanding, interpreting, and sharing data.
Catherine's "Manifesto" explains why this is important:
-
I believe design can contribute to public debates by creating information-rich, easy-to-understand graphics revealing the meaning of data without hiding its complexity. While the Internet allows even greater access to economic data than ever before, much of it is hidden in databases, spreadsheets and academic papers. At the same time, the discussion of economics in the media can be confusing and contradictory. Often numbers are quoted out of context, while political agendas distort the presentation of economic data. The goal of this site is to help people who are interested in the subject of economics (but are not experts) to understand and participate in public discussions about economics through data visualizations.
Wednesday, October 8, 2008
Truthiness, quants, software, glitches, experts, and steps towards solutions...
Here is an example of something I think touches upon the usefulness of the "truthiness" concept.
Although the following article was written in 2003, it holds up well in 2008. The seeds of truthiness were planted well before Stephen Colbert came up with the word:
What the Quants Don't Learn in College
(Emanual Derman, Risk Magazine-Trends July 2003/Volume 16/No7)
"The only universally applicable law is that of approximate similarity, which states that the best estimate of the unknown market value of a security is the price of another security that's closely similar to it. You need to find (or invent) a model to establish the similarity between two securities by demonstrating the equivalence of their future payouts under a wide range of circumstances....
Suspend disbelief
Although all you have is the limited power of this simple law, you must take your model of similarity seriously. Temporarily, like a fiction reader, you must suspend disbelief in your model. Then, when it's complete, remind yourself that economics and valuation involve the behaviour of people, and think hard about what could go wrong...
On Wall Street, no-one knows what the correct model is, but they go ahead and price and trade anyhow. It's a bit like the trial in Alice in Wonderland...Academics often over emphasise models, but much of the success of a model depends on software engineering....You need live market data, historical time series, databases, input screens and calibration. As a result, for every financial engineer who works on a model you may need three or four more software engineers to make it usable.."
I wonder if any Wall Street companies hired additional software engineers. From what has transpired over the past months, if they did, they were not the right software engineers!
UPDATE: Please read the comments to this post for clarification of Calyx software errors by a representative of the company. The passage below is my original post.
To take a closer look at how software problems might have played a small part in the current situation, I chose to browse the Calyx Software website. Calyx provides software that is used by Freddie Mac and Fannie Mae. There is a treasure trove of information about the quality of this companies mortgage processing software on its support pages.
From my armchair analysis of the types of errors reported, it seems that it is not difficult for mortgage brokers to unknowingly make errors when determining a potential borrower's risk. The Freddie Mac Loan Prospector looks like it was rolled out before important errors were discovered. In my opinion, it was designed without the capacity to prevent critical errors.
Because the Calyx support page lists many of the problems as common, it is likely that the Freddie Mac Loan Prospector was designed with a lower level of error prevention than expected for this sort of transaction. To fix this problem after the fact, the support pages offer help solutions, but some of the solutions are quite complex.
Common Problems with the Freddie Mac Loan Prospector
Second home is not included in ratios
Credit Agency Missing from the Freddie Mac Loan Prospector
Credit Agency or Lender is Missing from Point
Little things that waste time
Experts depend on accurate, reliable data in order to make effective decisions, but our current systems did not do the job. Even so, it is worth keeping track of what the experts have to say about the crisis:
Must-watch video
If you have about an hour, watch this discussion between Charlie Rose, Floyd Norris, Mohamed El-Erian, Gretchen Morgenson, and Nouriel Roubini, which aired at the time of the Fannie Mae and Freddie Mac "bailout" decision.
According to Floyd Norris, "The senior managers of the banks assumed that the whizzes under them had their financial models which proved that they did not have any value at risk, and had nothing to worry about, and they believed all of this. And now what they believed looks like nonsense, and you wonder why they did. And that left those banks very exposed... In a lot of cases, they thought they were making money, but they really weren't."
The one thing that is clear to me is that our current economic models no longer function. We can't put the blame on the quants, or the politicians, or the greedy Wall Street leaders. We can't put the blame on new homeowners with low-incomes, or pressured lenders.
Right now, there is a high level of uncertainty, and we do not have anything tangible that ensures that things will be OK. This problem can not be solved quickly. We need better models that can support effective economic decision-making on Wall Street, Main Street, and everywhere in between.
The problem of preventing future economic disasters won't be solved by politicians, government officials, economists, and Wall Street leaders. The general public is strongly against the rescue bailout. It simply is too difficult to trust those we've blamed.
My idea for a collaborative interactive time-line is just one small step (see sidebar).
We need to stretch our thinking and cast a wide net. This will require an interdisciplinary approach, and include people from a variety of disciplines, who are untainted by monetary scandals and have innovative minds, who care about future generations, and who believe strongly that in a democratic society, all citizens must have access to accurate, understandable information in order to make effective decisions - in all aspects of their lives.
Who might these people be? University researchers, practitioners in the workplace, graduate students, soccer moms, grandpas...with experience in areas such as finance, psychology, history, geography, urban planning, business, economics, banking, sociology, computer science, human-computer interaction, information visualization, graphic arts, & communications.
It is up to everyone to wake up and take action in some way.
Gordon Gekko, Wall Street, and Behavioral Finance
1987 was not a very good year for the U.S. economy. The "Go-Go '80's were fueled by a touch of greed. Nothing explains this better than the following clip of Gordon Gekko, a fictional corporate raider played by Michael Douglas in the movie Wall Street. Gekko firmly believed that greed is good. Ironically, the events in the movie forshadow the scandals that have been played out on Wall Street and corporate America over the past 21 years. Below is a quote from Gekko's speech, and the corresponding video clip I found on YouTube.
"The point is, ladies and gentlemen, that greed, for lack of a better word, is good. Greed is right, greed works. Greed clarifies, cuts through, and captures the essence of the evolutionary spirit. Greed, in all of its forms: greed for life, for money, for love, knowledge, has marked the upward surge of mankind". - Gordon Gekko (Memorable Quotes from Wall Street)
(I will take down this video if I'm notified that it violates someone's copyright.)
Humans are complex creatures. It would be challenging to create a behavioral finance application that could account for and predict various psychological and sociological scenarios. What would represent a constant? What characteristics, traits, behaviors, and inclinations would play as variables?
Here are a few:
Perhaps "greed" is an important human factor that should be incorporated into this affective/behavioral/financial applications. There are quite a few more:
"herd mentality", "politics", "power", "control", "need for constant adrenaline rush", "sins of omission", "sins of commission", "consumer confidence", "illusion of stability", "cluelessness", and of course, "truthiness".
I don't intend this to be a joke. In real life, this would be a serious endeavor. I am not sure that Wall Street quants would try to figure ways to quantify the concept of truthiness.
Behavioral Finance Resources
Behavioral Finance: Benefiting from Irrational Investors
(Julia Hanna, Harvard Business School)
"Behavioral finance replaces the traditional and idealized idea of rational decision makers with real and imperfect people who have social, cognitive, and emotional biases. The resulting inefficiencies in the capital markets can create opportunities for investment managers and firms."
Behavioral Finance: A Review and Synthesis pdf
(Avanidhar Subrahmanyam, 2006)
The Behavioral Finance Hoax pdf
(Richard Michaud)
Detailed presentation, includes theories and formulas:
A Survey of Behavioral Finance
(Nicholas Barberis, Richard Thaler, presented by Ryan Samson, CalTech)
Behavioral Finance at JP Morgan
(Malcolm P. Baker, Aldo Sesia Jr. 2007, Harvard Business Publishing)
Did we for get the lessons learned from Enron?
Did we forget the lessons from Enron?
There was quite a bit of publicly available information around related to the Enron fiasco in 2001. Available on-line is the Enron Explorer e-mail visualizer, which was created from the database of all of the email messages between Enron's senior management team as things were falling apart between 1999-2002.
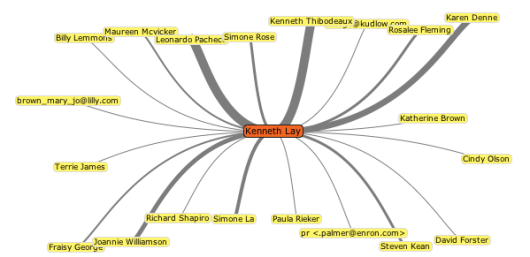

visualcomplexity.com
The following NY Times article (February 2002) will refresh your memory: Enron's Many Strands: The Company Unravels; Enron Buffed Image to a Shine Even as it Rotted from Within
Punishment was not swift, as the trial ended in 2006:
Two Enron Chiefs are Convicted in Fraud and Conspiracy Trial (NY Times, 2006)
"... the executives had sanctioned or encouraged manipulative accounting practices and then crossed the line from cheerleading into outright misrepresentations of financial performance."
"Enron's fall had a far greater impact than on just the energy industry by heightening nervousness among average investors about the transparency of American companies. "The Enron case and all the other scandals and cases that trailed after it may have finally punctured that romance with Wall Street that has been true of American culture for a while now," said Steve Fraser, a historian and author of "Every Man a Speculator: A History of Wall Street in American Life."
There was quite a bit of publicly available information around related to the Enron fiasco in 2001. Available on-line is the Enron Explorer e-mail visualizer, which was created from the database of all of the email messages between Enron's senior management team as things were falling apart between 1999-2002.
visualcomplexity.com
The following NY Times article (February 2002) will refresh your memory: Enron's Many Strands: The Company Unravels; Enron Buffed Image to a Shine Even as it Rotted from Within
Punishment was not swift, as the trial ended in 2006:
Two Enron Chiefs are Convicted in Fraud and Conspiracy Trial (NY Times, 2006)
"... the executives had sanctioned or encouraged manipulative accounting practices and then crossed the line from cheerleading into outright misrepresentations of financial performance."
"Enron's fall had a far greater impact than on just the energy industry by heightening nervousness among average investors about the transparency of American companies. "The Enron case and all the other scandals and cases that trailed after it may have finally punctured that romance with Wall Street that has been true of American culture for a while now," said Steve Fraser, a historian and author of "Every Man a Speculator: A History of Wall Street in American Life."
KPMG, Enron Visualizations, Fannie Mae, and New Century Financial
Not long after the Enron scandal, questionable practices involving accounting irregularities were discovered at Freddie Mac in 2003, resulting in firing of David W. Glenn, the president, and forced resignations of Leeland C.Brendsel, the chairman and CEO, and Vaughn A. Clarke, the CFO. Initially, the executives were rewarded for bad decision making.
Leeland C. Brendsel's severance package was $24 million, which was eventually protested:
Freddie Mac Severance Pay is Protested
(Alex Berensen, NY Times, 6/13/2003)
" ...Standard & Poor's cut its stock rating on Freddie Mac to avoid from hold. ''We believe the company has been less than forthright in giving investors adequate information regarding recent investigations,'' Standard & Poor's said. ''We are concerned about the magnitude of the investigation and its potential political fallout.'' "
At the same time, Fannie Mae was in trouble. An article in the NY Times, written by Jennifer Lee in 2004, outlined the findings of Federal regulators regarding significant problems in the accounting practices used by Fannie Mae related to amortization and derivatives:
Overseer Says Fannie Mae Due for a Shake-Up
"The accounting techniques used by Fannie Mae effectively resulted in off-balance sheet reserves that were used to smooth earnings to meet the expectations of financial analysts, according to the report."
KPMG was the firm that certified Fannie Mae's books at the time. Fannie Mae fired KPMG, and later sued the company, according to a 2006 NY Times article.
KPMG also certified the books of New Century Financial, which failed in 2007:
Inquiry Assails Accounting Firm in Lender's Fall
"New Century Financial, whose failure just a year ago came at the start of the credit crisis, engaged in “significant improper and imprudent practices” that were condoned and enabled by auditors at the accounting firm KPMG, according to an independent report commissioned by the Justice Department...E-mail messages uncovered in the investigation showed that some KPMG auditors raised red flags about the accounting practices at New Century, but that the KPMG partners overseeing the audits rejected those concerns because they feared losing a client."
I wonder just what data was missing or mis-represented.
Celestial Economic Sphere, Data Viz for the Finance Biz
(This is a revised segment from a very long post I wrote before starting this blog)
I came across this imag e of the Celestial Economic Sphere on a post by Shae Davidson one of the authors of the Creative Synthesis Blog, and thought it was a good symbol for the topics of this post.
The Celestial Economic Sphere was created by Lise Autogena and Joshua Portway for the Black Shoals Stock Market Planetarium. The sphere relies on financial data from 4,000 public companies to create a real-time visual display of stock trading:
"Within this environment, a complex ecology of glowing amoeba-like “artificial life” creatures emerge. The creatures live in a world composed entirely of money and they feed on trading activity. Whenever a stock is traded its’ equivalent star produces food for the creatures – the bigger the trade, the more food is produced. . . .Because the stock market has the kind of cybernetic properties of biological systems and other complex phenomena (feedback loops etc.), it can be studied in the same was as biological systems. This tends to give rise to a sense that the market is somehow a “natural” expression of some fundamental forces."
According to the Black Shoals creators, the planetarium was a response to the collapse of a capital management firm in 1998:
"Watching the news we would hear that the FTSE 100 had slipped today, and we knew that meant bad things would happen in the future, but the connections were invisible and mysterious, like the forces the ancient Babylonians thought were exerted on our lives by the stars of the zodiac. These were the time of the dot.com boom and the height of media interest in all things stock market related -- a time where the market was often equated to a kind of ecosystem with a life of its own, and where the internal dynamics of the markets appeared to be more important than it's ties to the real world....So Black Shoals was designed as a kind of parody of the trading desk of the ubermench-the Mount Olympus from which they would survey their creation."
The data visualization incorporates a complex artificial life algorithm or genetic algorithm, which is described in detail in Black Shoals: Evolving Organisms in a World of Financial Data.
Spore meets Wall Street!
Note: Black Shoals is a play on words. Shoals are a group of fish who swim together, but in this case. Black Shoals also refers to the Black Scholes formula based on the work of Fischer Black and Myron Scholes. Black and Scholes built the formula on the previous work of Louis Bachelier, known for the mathematical model of the stock market that gave birth to the concept of stock options.
Catherine Mulbrandon's Visualizing Economics blog provides a variety of data/information visualizations related to the US and World economy that are grounded in reality. She collects and creates interesting representations that make it easier to understand economic concepts. Topics include Nominal vs Real 3-Month Interest Rate 1934-2008, Percentage of World GDP - Past 500 Years, (take a look at the comments for the post), Two Thousand Years of Growth: World Income & Population, and US Inflation: Annual Percent Change (1774-2007).
When I first heard about the Wall Street storm, I wondered how things could have Saul Hansell, the author of "Where Were the Quants? How Wall Street Lied to Its Computers".
Were the quants mesmerized by their faulty numbers, insisting that no hurricane was coming our way?
According to Hansell, part of the problem is that the computer models related to risk analysis in the financials simply did not account for the complex changes in the industry. The information entered into the computers was faulty, and in turn, the data modeling was flawed. Important decisions were made based on what streamed out of the computers. One of Hansell's quotes indicates that this was not a mistake:
“There was a willful designing of the systems to measure the risks in a certain way that would not necessarily pick up all the right risks,” said Gregg Berman, the co-head of the risk-management group at RiskMetrics, a software company spun out of JP Morgan. “They wanted to keep their capital base as stable as possible so that the limits they imposed on their trading desks and portfolio managers would be stable.”
As I mentioned previously, the Celestial Economic Sphere/Black Shoals Stock Market Planetarium was created in response to a 1998 collapse of a capital management firm that sent the London FTSE 100 spiraling downward. If you visit the Black Shoals website, you'll see that there was plenty of information that was available to the public at the time that outlined the economic problems going on at the time.
I came across this imag
e of the Celestial Economic Sphere on a post by Shae Davidson one of the authors of the Creative Synthesis Blog, and thought it was a good symbol for the topics of this post.The Celestial Economic Sphere was created by Lise Autogena and Joshua Portway for the Black Shoals Stock Market Planetarium. The sphere relies on financial data from 4,000 public companies to create a real-time visual display of stock trading:
"Within this environment, a complex ecology of glowing amoeba-like “artificial life” creatures emerge. The creatures live in a world composed entirely of money and they feed on trading activity. Whenever a stock is traded its’ equivalent star produces food for the creatures – the bigger the trade, the more food is produced. . . .Because the stock market has the kind of cybernetic properties of biological systems and other complex phenomena (feedback loops etc.), it can be studied in the same was as biological systems. This tends to give rise to a sense that the market is somehow a “natural” expression of some fundamental forces."
According to the Black Shoals creators, the planetarium was a response to the collapse of a capital management firm in 1998:
"Watching the news we would hear that the FTSE 100 had slipped today, and we knew that meant bad things would happen in the future, but the connections were invisible and mysterious, like the forces the ancient Babylonians thought were exerted on our lives by the stars of the zodiac. These were the time of the dot.com boom and the height of media interest in all things stock market related -- a time where the market was often equated to a kind of ecosystem with a life of its own, and where the internal dynamics of the markets appeared to be more important than it's ties to the real world....So Black Shoals was designed as a kind of parody of the trading desk of the ubermench-the Mount Olympus from which they would survey their creation."
The data visualization incorporates a complex artificial life algorithm or genetic algorithm, which is described in detail in Black Shoals: Evolving Organisms in a World of Financial Data.
Spore meets Wall Street!
Note: Black Shoals is a play on words. Shoals are a group of fish who swim together, but in this case. Black Shoals also refers to the Black Scholes formula based on the work of Fischer Black and Myron Scholes. Black and Scholes built the formula on the previous work of Louis Bachelier, known for the mathematical model of the stock market that gave birth to the concept of stock options.
Catherine Mulbrandon's Visualizing Economics blog provides a variety of data/information visualizations related to the US and World economy that are grounded in reality. She collects and creates interesting representations that make it easier to understand economic concepts. Topics include Nominal vs Real 3-Month Interest Rate 1934-2008, Percentage of World GDP - Past 500 Years, (take a look at the comments for the post), Two Thousand Years of Growth: World Income & Population, and US Inflation: Annual Percent Change (1774-2007).
When I first heard about the Wall Street storm, I wondered how things could have Saul Hansell, the author of "Where Were the Quants? How Wall Street Lied to Its Computers".
Were the quants mesmerized by their faulty numbers, insisting that no hurricane was coming our way?
According to Hansell, part of the problem is that the computer models related to risk analysis in the financials simply did not account for the complex changes in the industry. The information entered into the computers was faulty, and in turn, the data modeling was flawed. Important decisions were made based on what streamed out of the computers. One of Hansell's quotes indicates that this was not a mistake:
“There was a willful designing of the systems to measure the risks in a certain way that would not necessarily pick up all the right risks,” said Gregg Berman, the co-head of the risk-management group at RiskMetrics, a software company spun out of JP Morgan. “They wanted to keep their capital base as stable as possible so that the limits they imposed on their trading desks and portfolio managers would be stable.”
As I mentioned previously, the Celestial Economic Sphere/Black Shoals Stock Market Planetarium was created in response to a 1998 collapse of a capital management firm that sent the London FTSE 100 spiraling downward. If you visit the Black Shoals website, you'll see that there was plenty of information that was available to the public at the time that outlined the economic problems going on at the time.
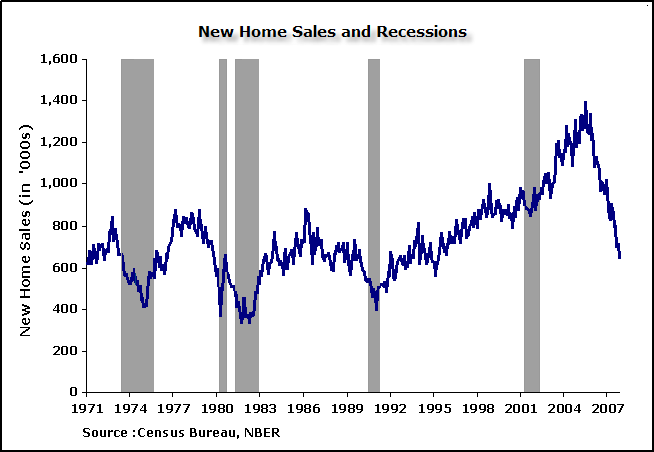
Deja Vu-Doo Economics
Deja Vu-Doo Economics is a term used in the media that refers to economic policies and philosophies that echo those put into place by President Ronald Reagan during the 1980's. Reagan's policies were called "Voo-Doo" economics by his nay-sayers, and were also known as "Reaganomics".
Reaganomics helped improve the economy during that decade, and as a result, which helped us forget how bad it was in 1981 and 1982.
.
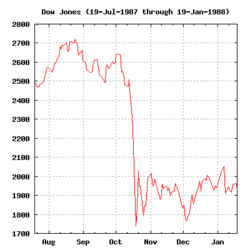
Some of us forgot that this led us to 1987, the year of Black Monday. The date was October 19, 1987. The stock markets around the world crashed to the ground, but by the end of the year, there was an uptick.
From Wikipedia:

I know I will have to dig a little deeper for the "truth"....sadly, much of what I've found that relates to economics is intertwined with politics and half-truths from both sides of the line.
The following article discusses topics such as Tobin's Q, the "Greater Fool Theory", and Professor Irving Fisher, of Yale University:
Why the Bull is a Compulsive Climber
Peter Passell, The New York Times
October 20, 1996
"Up, up, up it goes, and where it stops nobody knows. Since stock prices began climbing out of the trough of the 1990 recession, the Dow Jones industrial average has grown at 10 times the pace of the American economy. Perhaps as remarkable, investors have brushed aside every bit of troubling news -- from interest rate increases to the defeat of an incumbent Republican President -- with barely a hiccup. Not once in the last six years have stock prices fallen by as much as 10 percent."
Deja Vu-Doo Economics
Reagonomics or 'voodoo economics"?
BBC News, Saturday, June 5, 2004
The return of voodoo economics
Salon.com, September 5, 2002
Arianna Huffington
"There's another blast from the Reagan past that is a little more relevant to most Americans' current financial health than trickle-down dreams. Ask yourself, my friends, are you better off today, after all that tax cutting and deregulating, than you were four years ago?"
Additional resources:
Carlson, Mark (2007) "A Brief History of the 1987 Stock Market Crash with a Discussion of the Federal Reserve Response,"Divisions of Research & Statistics and Monetary Affairs Federal Reserve Board, Washington, D.C.
Black Monday Ten Years After: The Motley Fool's 1987 Timeline
(1997)
(The above resources were found on Wikipedia.)
Reaganomics helped improve the economy during that decade, and as a result, which helped us forget how bad it was in 1981 and 1982.
.
Some of us forgot that this led us to 1987, the year of Black Monday. The date was October 19, 1987. The stock markets around the world crashed to the ground, but by the end of the year, there was an uptick.
From Wikipedia:
I know I will have to dig a little deeper for the "truth"....sadly, much of what I've found that relates to economics is intertwined with politics and half-truths from both sides of the line.
The following article discusses topics such as Tobin's Q, the "Greater Fool Theory", and Professor Irving Fisher, of Yale University:
Why the Bull is a Compulsive Climber
Peter Passell, The New York Times
October 20, 1996
"Up, up, up it goes, and where it stops nobody knows. Since stock prices began climbing out of the trough of the 1990 recession, the Dow Jones industrial average has grown at 10 times the pace of the American economy. Perhaps as remarkable, investors have brushed aside every bit of troubling news -- from interest rate increases to the defeat of an incumbent Republican President -- with barely a hiccup. Not once in the last six years have stock prices fallen by as much as 10 percent."
Deja Vu-Doo Economics
Reagonomics or 'voodoo economics"?
BBC News, Saturday, June 5, 2004
The return of voodoo economics
Salon.com, September 5, 2002
Arianna Huffington
"There's another blast from the Reagan past that is a little more relevant to most Americans' current financial health than trickle-down dreams. Ask yourself, my friends, are you better off today, after all that tax cutting and deregulating, than you were four years ago?"
Additional resources:
Carlson, Mark (2007) "A Brief History of the 1987 Stock Market Crash with a Discussion of the Federal Reserve Response,"Divisions of Research & Statistics and Monetary Affairs Federal Reserve Board, Washington, D.C.
Black Monday Ten Years After: The Motley Fool's 1987 Timeline
(1997)
(The above resources were found on Wikipedia.)
Wall Street Journal's Interactive Graphics: Cracked Foundation; Housing Pain
Cracked Foundation is an interactive graphic that compliments an article in today's Wall Street Journal. A quick look at the first graph will tell you the scope of the problems facing the most hart-hit regions, in a way that words can not.
This is an example of visual information that would be useful in a interactive multimedia time-line.
October 8, 2008
Housing Pain Gauge: Nearly 1 in 6 Owners 'Under Water" (James R. Hagerty and Ruth Simon)
"More Defaults and Foreclosures Are Likely as Borrowers With Greater Debt Than Value in Their Homes Are Put in a Tight Spot"
Sunday, October 5, 2008
CNN Money.com website's timeline of our economic woes...
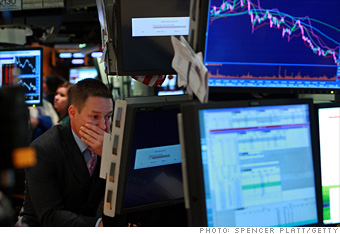
Note: This photo is from the CNN Money.com website, and the photo is attributed to Spencer Platt/Getty. I am using this for educational purposes. The fall of the market is dramatically depicted on the screen the upper right hand corner of the photo, and the human response to the shock is reflected in the body language and expression of the man staring at his computer display. I will take the photo it down if it is requested.
CNN Money.com has a time-line of the recent events surrounding our current economic woes:
The crisis: A timeline
"A shocking series of events that forever changed the financial markets"
The CNNMoney.com timeline offers a bit of interactivity, but it is primarily text-based. Each article embeds links to related information, which is a good feature.
Link to Wachovia Timeline Article: Key Events, 1879 to Sept. 2008
I'm posting links to time-lines that contain information that could be used for an interactive multimedia economic timeline. Since I live in Charlotte, N.C., I thought I'd look for information about Wachovia.
At the time of this post, it was not certain if CitiGroup or Wells Fargo would be playing a part in the transformation of this bank.
Take a look at the Wachovia Corporation Timeline. I haven't verified the facts listed in the timeline.
Warning: The time-line is text-based, and it is not interactive.
Imagine how a rich sources of information this could be if it was transformed into interactive multimedia time-line!
Instead of text, with events listed in a linear fashion, an interactive multimedia time-line would be more exciting to play with. It would allow you to explore pictures, listen to interviews, watch video clips, peek at artifacts, and branch off to explore related links to other historical, political, and cultural dynamics that were going on at the time of each event.
If the timeline was collaborative, it would become a living document, sort of like a wiki, but in a different format.
Subscribe to:
Posts (Atom)