This blog was created to gather information for an interactive timeline application to provide people with tools for analyzing the factors, history, people, events related to the economic crisis of the late 2000's. The timeline application prototype is a work in progress.
Here are some of the headlines and related quotes about the allegations of a possible Ponzi scheme run by R. Allen Stanford and other officials of the Stanford Financial Group:
"In carrying out this scheme, the SEC claims, Messrs. Stanford and Davis misappropriated billions of investors' money and falsified the Stanford International Bank's records to hide their fraud.
"Stanford International Bank's financial statements, including its investment income, are fictional," the SEC said."
"Mrs. Pendergest-Holt’s ties and loyalty to Stanford Financial appear to run deep. She married James Holt, who ran a hedge fund that managed a portion of the assets held at the Antigua bank. Her brother-in-law helped oversee a team of 20 analysts that monitored the performance of various asset managers."
Stanford Scandal Sam Jones, Sheila McNulty, Michael Peel, Financial Times, 2/27/09
"The SEC document paints a curious picture of Ms Pendergest-Holt as both insider and ingénue, who became a senior executive of a vast business empire in spite of having “no experience in the financial services or securities industries”.
John Bird and John Fortune are a British satirical team that participated in a four-part mini series in November 2008, called Silly Money. Their humorous sketches reflect truths about the ongoing economic crisis. Enjoy!
Search Web
Highlight/Clear
Daily Readings
Home Page
Reload
Part 1 of 3
Part 2 of 3 (Discusses correlation concept, behavioral finance, quants)
Part 3 of 3
(Note: Some parts off the discussion might be offensive.)
Some quotes from the clips: "You have to remember two things about the markets. One is that they are made up of very sharp and sophisticated people who are the greatest brains in the world. The second thing, the markets are, to use a common phrase, are driven by sentiment".
The two go one to explain the dynamics of sentiment on the market, the relationship between dodgy debt packages and structured investment vehicles, and so on, how this relates to hedge funds with fancy names.
"Somehow this package of dodgy debts stops being a package of dodgy debts and starts being called a "structured investment vehicle".
"Shouldn't you have seen this coming?"
"Well, we didn't exactly foresee it, in the strict sense of the word."
"Or in any sense of the word."
"Yes, but when it happened, we DID notice it, which is almost as good, isn't it?"
"It's not us that will suffer, it is your pension fund".
When the economy started to collapse, one of the first things I wondered was how it could happen so fast, in so many sectors. I was baffled that so many bright math & finance minds did not seem to have the tools to communicate the depths of the problem in a way that decision-makers could understand.
At that point in time, pre- Bernie Madoff, I still had some faith in our system, but still, I wondered how so many math "geniuses" could be asleep at the wheel, all at the same time! I came across an article by Saul Hansell in the New York Times in September 2008 that explained things just enough to open my eyes to the reality of the situation: "How Wall Street Lied to Its Computers: So where were the quants?"
Well, that was five months ago.The economy continues to plummet, gasping for breath from time-to-time. The article below does a good job of explaining some of the more confusing sets of events:
"Here's what killed your 401(k)David X. Li's Gaussian copula function as first published in 2000. Investors exploited it as a quick—and fatally flawed—way to assess risk. A shorter version appears on this month's cover of Wired."
Probability
Specifically, this is a joint default probability—the likelihood that any two members of the pool (A and B) will both default. It's what investors are looking for, and the rest of the formula provides the answer.
Survival times
The amount of time between now and when A and B can be expected to default. Li took the idea from a concept in actuarial science that charts what happens to someone's life expectancy when their spouse dies.
Equality
A dangerously precise concept, since it leaves no room for error. Clean equations help both quants and their managers forget that the real world contains a surprising amount of uncertainty, fuzziness, and precariousness.
Copula
This couples (hence the Latinate term copula) the individual probabilities associated with A and B to come up with a single number. Errors here massively increase the risk of the whole equation blowing up.
Distribution functions
The probabilities of how long A and B are likely to survive. Since these are not certainties, they can be dangerous: Small miscalculations may leave you facing much more risk than the formula indicates.
Gamma
The all-powerful correlation parameter, which reduces correlation to a single constant—something that should be highly improbable, if not impossible. This is the magic number that made Li's copula function irresistible.
More from the Wired article:
"Li's copula function was used to price hundreds of billions of dollars' worth of CDOs filled with mortgages. And because the copula function used CDS prices to calculate correlation, it was forced to confine itself to looking at the period of time when those credit default swaps had been in existence: less than a decade, a period when house prices soared. Naturally, default correlations were very low in those years. But when the mortgage boom ended abruptly and home values started falling across the country, correlations soared."
"In many cases, the investors have no clue how many levels of re-bundling are going on to create their top-tranch low-risk bond. And you've got all sorts of people who thought they were buying conservative investments who are now stuck with their money invested in bundles of low-tranch shit loans."
Jonathan Jarvis created a series of animated shorts as a project for his work as a graduate student in the Media Design Program at Art Center College of Design. He started exploring the concept of system diagrams and integrated them into motion interactions.
Allen Stanford, a Texas billionaire,was accused of defrauding 13,000 clients of his company, Stanford Financial, this week. Clients thought that their money was invested in certificates of deposit, but evidence was found that suggests that Stanford's investment strategies boiled down to a Ponzi scheme.
In keeping with the "Economic Sounds and Sights" theme of this blog, I'm sharing the following parody of a familiar ad, highlighting the Ponzi scheme created and maintained by Bernie Madoff. Enjoy!
"Parody of the Free Credit Report.com "Pirate" ad featuring Financial Supervillain Bernie Madoff. Sentenced to a lifetime of Restaurant servitude, perhaps he will pay off the money he owes a few bucks at a time. Written and produced at Flinch Studio for Mark Cuban's "Blog Maverick"
I visited Mark Cuban's blog and found that he has some interesting things to say about the Bernie Madoff scam:
Breaking Down Bernie Madoff "Find the programmers who wrote the software and you will find out how the whole thing worked." Breaking Down Bernie Madoff P2 & 3 "Curiosity got the best of me. So I started doing some searching on the electronic trading platform Bernie built. They called it Primex. Its an electronic auction system for securities. According to media reports, it was the “brainchild of Bernie and Peter Madoff"."
The top layer of the map represents the derivatives volume, and the bottom layer represents the GDP.
Andreas Nicolas Fischer: "This sculpture is a statistical map, a hybrid between physical and conceptual space. The horizontal arrangement equates to the Mercator projection of a world map and the vertical axis metaphorically corresponds to the financial activity of the country."
Related Articles: Derivatives Volume
OTC Derivatives Volume Posing Problems Gregory Bresiger, Traders Magazine 3/19/2008 "The explosion in over-the-counter derivatives trading could overwhelm the timely processing and settlement procedures of brokerages."
“In fact, the overstressed credit derivatives market infrastructure has created the potential for a financial disaster if an event triggers a significant strain, such as a major U.S. company filing for bankruptcy. Unless this technology is updated and improved, the industry will continue to operate with lead weights and put the health of the market overall at risk,” added Benedetto."
Financial Markets- Subprime mortgage crisis: are credit derivatives to blame?-laCaixa Research Department, Monthly Report, num 308- December 2007 "Warren Buffet, the world’s best-known investor, once called financial derivatives «time bombs». On the other hand, Alan Greenspan, former governor of the Federal Reserve, believes they are «indispensable tools for managing risk». Surely, however, both would be in agreement that financial derivatives constitute one of the key factors in the subprime mortgage crisis."
"But, what are financial derivatives? A derivative is a financial instrument whose value is based on the price of another asset, called an underlying asset. An example is an option to buy 1,000 General Electric shares within one year at a fixed price of 40 dollars. The option buyer has a benefit if within one year the price goes above 40 dollars since he will be able to buy an asset which perhaps is worth 60 dollars although it cost only 40. In this case, the possibility, but not the obligation, to buy is what we understand by a financial derivative and the General Electric shares constitute the underlying asset, that is, the pre-existing asset and what gives us the price of the derivative."
Credit Derivatives: An Overview (pdf) David Mengle, Head of Research, International Swaps and Derivatives Association Atlanta Fed's May 2007 Financial Markets Conference, "Credit Derivatives: Where's the Risk?" "Costs. It is often argued that the flip side of wider and deeper risk transfer is that, instead of exerting a stabilizing influence on markets, it is potentially destabilizing because it transfers risk from participants that specialize in credit risk (that is, banks) to participants with less experience in managing credit risk—for example, insurers and hedge funds (“Risky business” 2005, for example). In addition, there is the danger that anything used to disperse risk can also be used by investors seeking yield enhancement to concentrate risk. Finally, these new institutions generally fall outside the regulatory reach of agencies that oversee various aspects of the credit markets." Regulation and Financial Innovation Speech: Chairman Ben S. Bernanke, Atlanta Fed's May 2007 Financial Markets Conference Conclusion "Financial innovation has great benefits for our economy. The goal of regulation should be to preserve those benefits while achieving important public policy objectives, including financial stability, investor protection, and market integrity. Although financial innovation promotes those objectives in some ways, for example by allowing better sharing of risks, certain aspects of financial innovation--including the complexity of financial instruments and trading strategies, the illiquidity or potential illiquidity of certain instruments, and explicit or embedded leverage--may pose significant risks. These risks should not be taken lightly."
"The difficulties lie in the details, and that is where accidents could happen." "During 2004 and 2005 it was increasingly apparent that institutions were not obtaining the necessary consents prior to assigning their obligations to a third party. The danger arose that this would become market-practice – a situation that would have undermined the very usefulness of the credit derivatives market. Unauthorised assignments posed the risk that participants in the credit derivatives market could not be sure who their counterparties were and to what extent they could rely on the credit derivatives that they had written or bought. If a credit default event occurred, the buyer of protection would not necessarily have been able to find the entity responsible to provide protection and/or to enforce its claim on that provider. Correspondingly, regulators had concerns as to whether banks and investment firms could accurately measure counterparty risk and/or credit risk. This had knock-on effects on firms' ability to calculate large exposures and capital requirements."
OCC Reports Derivatives Volume Tops $96 Trillion Hoosier Banker, 10/01/2005 "Derivatives held by U.S. commercial banks increased by $5.1 trillion in the second quarter of 2005, to $96.2 trillion, the Office of the Comptroller of the Currency reported Sept. 30 in its quarterly Bank Derivatives Report."
"Kathryn Dick, Deputy Comptroller for Risk Evaluation, said that while the notional amount of derivatives is a reasonable reflection of business activity, it does not represent the amount at risk for commercial banks. The risk in a derivatives contract is a function of a number of variables, such as whether counterparties exchange notional principal, the volatility of the currencies or interest rates used as the basis for determining contract payments, the maturity and liquidity of contracts, and the creditworthiness of the counterparties in the transactions, she said.The OCC also reported that credit derivatives increased by $981 billion, to $4.1 trillion.
"Low worldwide interest rates and credit spreads have let to strong client demand for credit instruments, and the growth in notional volumes reflects that," said Dick. "Our large dealer banks have targeted credit derivatives as an important segment of their product mix, and a critical aspect of our supervision is to work with other agencies to ensure that the dealer community has the appropriate operational infrastructure to support this growing market".
"Of course, things can go wrong. It is possible that the pricing of ever more complicated instruments might sometimes be too much even for the ultra-brainy lot who do it, with expensive results. Tranched instruments have no clear market price, so they have to be valued with complex models. Working out whether a default in a portfolio is likely to be an isolated event, or is a harbinger of more to come, is especially tricky, not least because data on credit defaults are relatively sparse. Some worry about the increased activity of hedge funds which, lured by the yield on illiquid, complicated instruments, make up as much as 70% of trading volume in credit derivatives, by some counts."
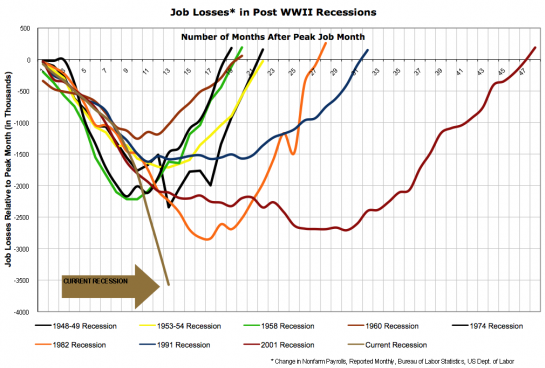
, inspired by a debate on Barry Ritholtz' blog, The Big Pictureabout the extent of the job losses experienced during the current recession. (Nathan's blog provides links to related sources and articles.)
Time to Recover from Job Losses in Post WWII Recessions
I plan to watch David Faber's "House of Cards", a CNBC Special Report, takes a close look at the slicing and dicing of mortgages. It premiers on Thursday, February 12th, at 8p. If you miss it, it is scheduled at the following times:
"In a special two-hour report, CNBC's David Faber takes an in-depth look at the causes of the ongoing collapse of the housing industry."
* Saturday, February 14, 2009 at 7p/10p ET * Sunday, February 15, 2009 at 9p ET * Monday, February 16, 2009 at 6a/8p/12a ET * Saturday, March 1, 2009 at 12a ET * Sunday, March 15, 2009 at 9p ET
"Faber follows the story from mortgage broker to homeowner, brokers to ratings agencies and all the way to former Federal Reserve Chairman Alan Greenspan. Most of what preceded the credit meltdown, which started in September 2007, happened under his watch, and in Faber’s interview, Greenspan admits that even he couldn’t explain collateralized debt obligations – and he had a couple of hundred Ph.D.s on staff." -Tom Brennan, CNBC
Update: David Faber discusses "House of Cards" with Charlie Rose
I came across the late economist Pierre Rinfret's website pages recently and found them to be informative and amusing. During the last several years of his life, Rinfret shared his experiences and views about economics and politics with the world, via the Internet, compelled by a desire to share his wisdom with the next generation.
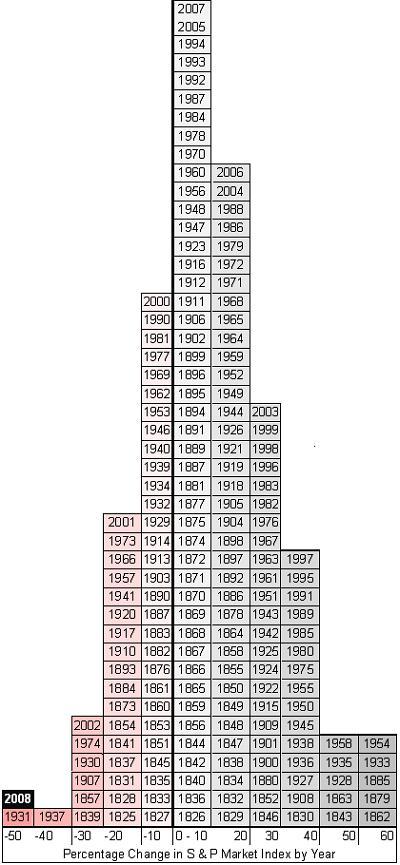
As I write this post, leaders of the financial industry, large corporations, and governments are in Davos, Switzerland at the annual meeting of the World Economic Forum. It is interesting to note that all of these bright men and women are struggling to grasp the enormity of the world's financial crisis and come up with strategies that hopefully will work. The graphic below depicts how much has changed in the world economy between the 2008 annual meeting of the World Economic forum and the present. It lacks the "wow" factor that one would expect for an application running on an interactive display. With some tweaking, it could be transformed into an application that supports two people interacting with the data at the same time.
"On this chart each block represents a year and each column represents a range of return on the S&P index. Over on the right side are those lucky years where the index has soared upward from 50-60%. In the middle are the more typical years, where the market has risen less than 10%.That little box on the far left? Yeah, that's this year..And hey, how many of you knew the S&P had been around since 1825?." - Devilstower of the Daily KOS
I've been thinking about interactive information visualization and how it can support our understanding of the current economic crisis a bit lately, inspired by what I learned in Dr. Robert Kosara's InfoViz class I took last year. In a recent post on the Eager Eyes blog, Dr. Kosara floats the idea of the establishment of a "National Data Agency".
"What we need is a National Data Agency (NDA). This agency would be tasked with collecting data that all other agencies collect and produce, and making it available in a central place and in electronic, machine-readable form. There could and should be a reasonable data presentation on its website, perhaps even a National Data Dashboard (showing data of interest like debt, spending, jobless rate, etc.). But the bulk of data analysis would be left to third parties: analysts, journalists, citizens (and also aliens like me). Easily available data would make for more insightful reporting, more informed decisions, and endless business opportunities."-Robert Kosara
This makes sense.
There simply is too much data to absorb, explore, analyze, understand, and act upon. It is difficult to know if you have all of the data that you need, because some of it is difficult to access. It doesn't matter if you are a banker, a stock broker, a CEO, a CFO, a government leader, an economist, a shareholder, or a student. The current state of world economic affairs is the strongest evidence that our methods simply aren't working.
The work of Hans Gosling provides a good example of how information visualization can help increase our understanding of large quantities of data over time. Hans Gosling is a Swedish professor of development and one of the founders of Gapminder. ("Unveiling the beauty of statistics for a fact-based world view".) The following video is Rosling's latest presentation, focused on debunking the myths regarding population growth:
Rosling Explains: Global Economy, Income, and Decline of Poverty
"Gapminder is a non-profit venture promoting sustainable global development and achievement of the United Nations Millennium Development Goals by increased use and understanding of statistics and other information about social, economic and environmental development at local, national and global levels. We are a modern “museum” that helps making the world understandable, using Internet."
The visual representation of economic data, if done well, packs a powerful punch. To me, images form a kernel in my memory related to the messages conveyed, and when recalled, also bring up a range of related conceptual details. It is sort of like what happens when I hear the first few notes of a tune from the past.
This doesn't seem to be the case for me when thinking about related text, or even thinking about "boring" charts and graphs.
The world needs effective and efficient data and information analysis and interactive visualization tools in order to solve problems that are on such a colossal scale.
The use of collaborative gesture and multi-touch display systems for data and information visualization is something that I believe will support better methods of decision-making in a variety of fields.Now is the time for the interactive information visualization community and related disciplines such as interactive multimedia and HCI to assist in this effort.
Here are some thoughts:
Those who are coding gesture-based or multi-touch programs need to understand what sort of content people will explore, and make sure that applications provide flexibility in use.
Human-computer interaction specialists will need to continue the study a range of interfaces and interactions in order to determine what supports human cognition of larger amounts of data and information.
Creators of interactive multimedia content, web developers, and others will need to re-examine their work and think about ways their content can support new ways of thinking and problem-solving within the context of "surface" computing.
Computer Supported Cooperative Work researchers will need to figure out what needs to be in place so that information can be effectively shared and analyzed between pairs or teams of people, and how this information can best be communicated to others within a business, agency, or organization, as well as the public.
One of the challenges facing this effort is that few people have an in-depth understanding of what it will take to make it happen. We will need to take an inter-disciplinary effort requiring a much higher level of communication and collaboration between people not accustomed to working within this context.
We will also need to take a "big picture" approach. Because of the world's economic crisis, I think that interactive information/data visualization applications should target the needs of people who are working to understand the crisis and who have the power to do something constructive about it. This can not happen if they rely on the models and data analysis techniques of our recent past.
At the same time, these tools should be available to the rest of us, via the Internet, so that we may do our part to move us forward. Back Story:
I started keeping up with the current economic on a more serious level in October. I was becoming numb from information overload. My knowledge about the economic and financial fields was lacking, so I decided to create a blog that I entitled "Economic Sounds and Sights"as my personal on-line repository of searchable content.
The blog has lots of pictures, info-graphics, embedded video clips, and links to a wide range of web-based resources. In my quest for information, I came across interesting quotes, jokes about economists, and tales of greed and scandals. I even found one blogger who has responded to each unfolding event of our economic crisis by re-writing lyrics to popular tunes.
For an example of one of my posts, read "Celestial Economic Sphere, Data Viz for the Finance Biz..." It is my hope that the content I've collected and shared on the blog will become part of an interactive information visualization/timeline designed to support two or more people on a large display or table. RELATED
"The Sunlight Foundation is committed to helping citizens, bloggers and journalists be their own best congressional watchdogs, by improving access to existing information and digitizing new information, and by creating new tools and Web sites to enable all of us to collaborate in fostering greater transparency." MapLight.org"Money and Politics: Illuminating the Connection"
Free Our Data Blog(Guardian Technology campaign for free public access to data about the UK and its citizens)
Via Stephen Few: Example of Horizon Graphs, developed by Panopticon.(Year's worth of prices of 50 stocks in 2005 and comparisons between them, click to enlarge)
Mark Lombardi Take the time to listen to a Window Media audio file of NPR's Lynn Neary's interview with Robert Hobbs, curator of the an exhibit of the late Lombardi's "conspiracy" art/visualizations linking global finance and international terrorism. Lombardi's background as an archivist and reference librarian served him well in his art depicting interesting large-scale networks. Although his art was not interactive, his techniques have inspired the development of computer-based interactive information visualizations.
The examples below are of Lombardi's work connecting the relationships between George W. Bush, Harken Energy, and Jackson Stephens:
George W. Bush, Harken Energy and Jackson Stephens c. 1979-90, 5th Version 1999
Close-upof network detail
Close up depicting a profit made by Bush, 2 weeks before Saddam Hussein invaded Kuwait via Frances Richard
"...though he possessed the instincts of a private eye and the acumen of a systems-analyst, Lombardi was of course an artist, and from the raw material of wire-service reports and books by political correspondents, he drew not only chronicles of covert, high-stakes trade, but technically pristine and sensually compelling visual forms"-Frances Richard
Economic Sounds and Sightsis my on-line filing cabinet for resources and links related to our current economic crisis. (I am not an economist, and I do not belong to a political party.)In my quest to become a better-informed citizen, I know that I have much to learn. This blog is my way of sharing what I discover with others. I'd like to take this information to the next level, but I can't do this alone.
My vision? A collaborative multimedia, multi-modal interactive time-line might help us to understand the complex, interrelated factors and events more effectively. It would provide an opportunity for the inquisitive to view things from a broad perspective, and also explore things in rich detail. Ideally, the time-line would support multi-touch, multi-user interaction on larger displays and interactive whiteboards.


