Related:
For more information about housing price changes and finance topics, do a search on the Seeking Alpha website. Also check out Seeking Alpha's Breaking News page, for "real time commentary on the market, with links to key sources".
Seeking Alpha is the child of David Jackson, a former tech research analyst for Morgan Stanley. I plan on spending some time exploring the site. The nice thing about this site is that the articles are arranged a tagged so it is easy to find the information you need. The articles often contain lots of links, so you don't have to waste too much time digging deeper into topics of interest.
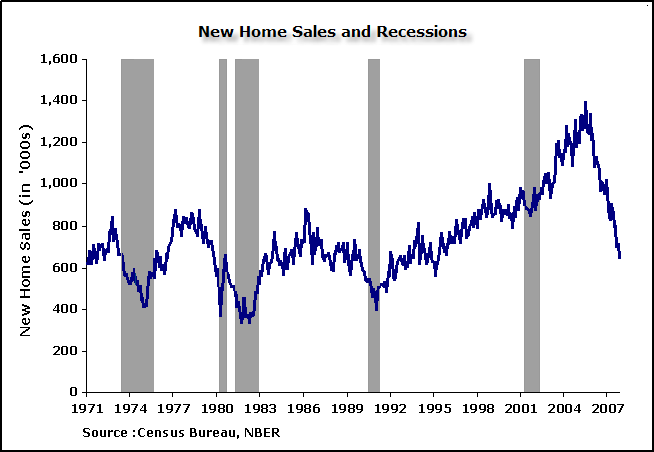
Below is a sample of some of the graphics related to US home prices via Seeking Alpha, in no particular order:


1 comment:
I didn't know that they are still using the template that I created while I was there. Thank you for the kind comment.
Post a Comment