This blog was created to gather information for an interactive timeline application to provide people with tools for analyzing the factors, history, people, events related to the economic crisis of the late 2000's. The timeline application prototype is a work in progress.
Showing posts with label economic crisis. Show all posts
Showing posts with label economic crisis. Show all posts
When the economy started to collapse, one of the first things I wondered was how it could happen so fast, in so many sectors. I was baffled that so many bright math & finance minds did not seem to have the tools to communicate the depths of the problem in a way that decision-makers could understand.
At that point in time, pre- Bernie Madoff, I still had some faith in our system, but still, I wondered how so many math "geniuses" could be asleep at the wheel, all at the same time! I came across an article by Saul Hansell in the New York Times in September 2008 that explained things just enough to open my eyes to the reality of the situation: "How Wall Street Lied to Its Computers: So where were the quants?"
Well, that was five months ago.The economy continues to plummet, gasping for breath from time-to-time. The article below does a good job of explaining some of the more confusing sets of events:
"Here's what killed your 401(k)David X. Li's Gaussian copula function as first published in 2000. Investors exploited it as a quick—and fatally flawed—way to assess risk. A shorter version appears on this month's cover of Wired."
Probability
Specifically, this is a joint default probability—the likelihood that any two members of the pool (A and B) will both default. It's what investors are looking for, and the rest of the formula provides the answer.
Survival times
The amount of time between now and when A and B can be expected to default. Li took the idea from a concept in actuarial science that charts what happens to someone's life expectancy when their spouse dies.
Equality
A dangerously precise concept, since it leaves no room for error. Clean equations help both quants and their managers forget that the real world contains a surprising amount of uncertainty, fuzziness, and precariousness.
Copula
This couples (hence the Latinate term copula) the individual probabilities associated with A and B to come up with a single number. Errors here massively increase the risk of the whole equation blowing up.
Distribution functions
The probabilities of how long A and B are likely to survive. Since these are not certainties, they can be dangerous: Small miscalculations may leave you facing much more risk than the formula indicates.
Gamma
The all-powerful correlation parameter, which reduces correlation to a single constant—something that should be highly improbable, if not impossible. This is the magic number that made Li's copula function irresistible.
More from the Wired article:
"Li's copula function was used to price hundreds of billions of dollars' worth of CDOs filled with mortgages. And because the copula function used CDS prices to calculate correlation, it was forced to confine itself to looking at the period of time when those credit default swaps had been in existence: less than a decade, a period when house prices soared. Naturally, default correlations were very low in those years. But when the mortgage boom ended abruptly and home values started falling across the country, correlations soared."
"In many cases, the investors have no clue how many levels of re-bundling are going on to create their top-tranch low-risk bond. And you've got all sorts of people who thought they were buying conservative investments who are now stuck with their money invested in bundles of low-tranch shit loans."
Allen Stanford, a Texas billionaire,was accused of defrauding 13,000 clients of his company, Stanford Financial, this week. Clients thought that their money was invested in certificates of deposit, but evidence was found that suggests that Stanford's investment strategies boiled down to a Ponzi scheme.
I plan to watch David Faber's "House of Cards", a CNBC Special Report, takes a close look at the slicing and dicing of mortgages. It premiers on Thursday, February 12th, at 8p. If you miss it, it is scheduled at the following times:
"In a special two-hour report, CNBC's David Faber takes an in-depth look at the causes of the ongoing collapse of the housing industry."
* Saturday, February 14, 2009 at 7p/10p ET * Sunday, February 15, 2009 at 9p ET * Monday, February 16, 2009 at 6a/8p/12a ET * Saturday, March 1, 2009 at 12a ET * Sunday, March 15, 2009 at 9p ET
"Faber follows the story from mortgage broker to homeowner, brokers to ratings agencies and all the way to former Federal Reserve Chairman Alan Greenspan. Most of what preceded the credit meltdown, which started in September 2007, happened under his watch, and in Faber’s interview, Greenspan admits that even he couldn’t explain collateralized debt obligations – and he had a couple of hundred Ph.D.s on staff." -Tom Brennan, CNBC
Update: David Faber discusses "House of Cards" with Charlie Rose
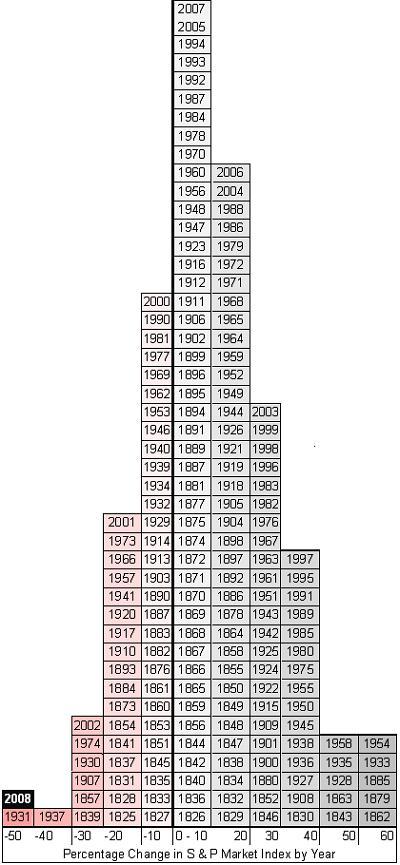
As I write this post, leaders of the financial industry, large corporations, and governments are in Davos, Switzerland at the annual meeting of the World Economic Forum. It is interesting to note that all of these bright men and women are struggling to grasp the enormity of the world's financial crisis and come up with strategies that hopefully will work. The graphic below depicts how much has changed in the world economy between the 2008 annual meeting of the World Economic forum and the present. It lacks the "wow" factor that one would expect for an application running on an interactive display. With some tweaking, it could be transformed into an application that supports two people interacting with the data at the same time.
"On this chart each block represents a year and each column represents a range of return on the S&P index. Over on the right side are those lucky years where the index has soared upward from 50-60%. In the middle are the more typical years, where the market has risen less than 10%.That little box on the far left? Yeah, that's this year..And hey, how many of you knew the S&P had been around since 1825?." - Devilstower of the Daily KOS
I've been thinking about interactive information visualization and how it can support our understanding of the current economic crisis a bit lately, inspired by what I learned in Dr. Robert Kosara's InfoViz class I took last year. In a recent post on the Eager Eyes blog, Dr. Kosara floats the idea of the establishment of a "National Data Agency".
"What we need is a National Data Agency (NDA). This agency would be tasked with collecting data that all other agencies collect and produce, and making it available in a central place and in electronic, machine-readable form. There could and should be a reasonable data presentation on its website, perhaps even a National Data Dashboard (showing data of interest like debt, spending, jobless rate, etc.). But the bulk of data analysis would be left to third parties: analysts, journalists, citizens (and also aliens like me). Easily available data would make for more insightful reporting, more informed decisions, and endless business opportunities."-Robert Kosara
This makes sense.
There simply is too much data to absorb, explore, analyze, understand, and act upon. It is difficult to know if you have all of the data that you need, because some of it is difficult to access. It doesn't matter if you are a banker, a stock broker, a CEO, a CFO, a government leader, an economist, a shareholder, or a student. The current state of world economic affairs is the strongest evidence that our methods simply aren't working.
The work of Hans Gosling provides a good example of how information visualization can help increase our understanding of large quantities of data over time. Hans Gosling is a Swedish professor of development and one of the founders of Gapminder. ("Unveiling the beauty of statistics for a fact-based world view".) The following video is Rosling's latest presentation, focused on debunking the myths regarding population growth:
Rosling Explains: Global Economy, Income, and Decline of Poverty
"Gapminder is a non-profit venture promoting sustainable global development and achievement of the United Nations Millennium Development Goals by increased use and understanding of statistics and other information about social, economic and environmental development at local, national and global levels. We are a modern “museum” that helps making the world understandable, using Internet."
The visual representation of economic data, if done well, packs a powerful punch. To me, images form a kernel in my memory related to the messages conveyed, and when recalled, also bring up a range of related conceptual details. It is sort of like what happens when I hear the first few notes of a tune from the past.
This doesn't seem to be the case for me when thinking about related text, or even thinking about "boring" charts and graphs.
The world needs effective and efficient data and information analysis and interactive visualization tools in order to solve problems that are on such a colossal scale.
The use of collaborative gesture and multi-touch display systems for data and information visualization is something that I believe will support better methods of decision-making in a variety of fields.Now is the time for the interactive information visualization community and related disciplines such as interactive multimedia and HCI to assist in this effort.
Here are some thoughts:
Those who are coding gesture-based or multi-touch programs need to understand what sort of content people will explore, and make sure that applications provide flexibility in use.
Human-computer interaction specialists will need to continue the study a range of interfaces and interactions in order to determine what supports human cognition of larger amounts of data and information.
Creators of interactive multimedia content, web developers, and others will need to re-examine their work and think about ways their content can support new ways of thinking and problem-solving within the context of "surface" computing.
Computer Supported Cooperative Work researchers will need to figure out what needs to be in place so that information can be effectively shared and analyzed between pairs or teams of people, and how this information can best be communicated to others within a business, agency, or organization, as well as the public.
One of the challenges facing this effort is that few people have an in-depth understanding of what it will take to make it happen. We will need to take an inter-disciplinary effort requiring a much higher level of communication and collaboration between people not accustomed to working within this context.
We will also need to take a "big picture" approach. Because of the world's economic crisis, I think that interactive information/data visualization applications should target the needs of people who are working to understand the crisis and who have the power to do something constructive about it. This can not happen if they rely on the models and data analysis techniques of our recent past.
At the same time, these tools should be available to the rest of us, via the Internet, so that we may do our part to move us forward. Back Story:
I started keeping up with the current economic on a more serious level in October. I was becoming numb from information overload. My knowledge about the economic and financial fields was lacking, so I decided to create a blog that I entitled "Economic Sounds and Sights"as my personal on-line repository of searchable content.
The blog has lots of pictures, info-graphics, embedded video clips, and links to a wide range of web-based resources. In my quest for information, I came across interesting quotes, jokes about economists, and tales of greed and scandals. I even found one blogger who has responded to each unfolding event of our economic crisis by re-writing lyrics to popular tunes.
For an example of one of my posts, read "Celestial Economic Sphere, Data Viz for the Finance Biz..." It is my hope that the content I've collected and shared on the blog will become part of an interactive information visualization/timeline designed to support two or more people on a large display or table. RELATED
"The Sunlight Foundation is committed to helping citizens, bloggers and journalists be their own best congressional watchdogs, by improving access to existing information and digitizing new information, and by creating new tools and Web sites to enable all of us to collaborate in fostering greater transparency." MapLight.org"Money and Politics: Illuminating the Connection"
Free Our Data Blog(Guardian Technology campaign for free public access to data about the UK and its citizens)
Via Stephen Few: Example of Horizon Graphs, developed by Panopticon.(Year's worth of prices of 50 stocks in 2005 and comparisons between them, click to enlarge)
Mark Lombardi Take the time to listen to a Window Media audio file of NPR's Lynn Neary's interview with Robert Hobbs, curator of the an exhibit of the late Lombardi's "conspiracy" art/visualizations linking global finance and international terrorism. Lombardi's background as an archivist and reference librarian served him well in his art depicting interesting large-scale networks. Although his art was not interactive, his techniques have inspired the development of computer-based interactive information visualizations.
The examples below are of Lombardi's work connecting the relationships between George W. Bush, Harken Energy, and Jackson Stephens:
George W. Bush, Harken Energy and Jackson Stephens c. 1979-90, 5th Version 1999
Close-upof network detail
Close up depicting a profit made by Bush, 2 weeks before Saddam Hussein invaded Kuwait via Frances Richard
"...though he possessed the instincts of a private eye and the acumen of a systems-analyst, Lombardi was of course an artist, and from the raw material of wire-service reports and books by political correspondents, he drew not only chronicles of covert, high-stakes trade, but technically pristine and sensually compelling visual forms"-Frances Richard
"Then, whether this housing bust will lead to a recession or not is the only remaining uncertainty: Krugman himself does not yet share my “certainty” - as he puts it – about a recession but, short of that certainty, he is fully of the view that the housing bust will be “ugly” and has some risks of triggering a broader economy-wide recession. So, the “Shrill Order of the Reality-Based Reputable Eeyores” is growing by the day and I am proud to be in company of such distinguished academic and non-academic colleagues." -Nouriel Roubini 8/26/06
A Conversation with Nouriel Roubini (Charlie Rose, 10/14/08)
(Nouriel Roubini is an economics professor at New York University.)
I thought I'd provide a partial transcript of this video clip for readers who might be hearing impaired. (I will be activating a blog-reader on this blog soon.)
Charlie Rose: "Where are we now in this continuum of this huge financial crisis?"
Roubini: "The recession will last at least two years.... there will be hundreds of banks going belly up. ...What we've done is avoiding a more severe catastrophe, a disaster. But still, it is going to be very, very painful for the real economy and for financial markets. We haven't reached the bottom yet."
"We discovered that the most sophisticated financial system in the world was totally fragile. Because we created an actual system where there was not proper rules, proper institution, proper supervision, and regulation. The ideology in Washington for the last 8 years regarding the financial market has been self-regulation."
"Self-regulation is meaningless. It means no regulation. It was an ideology based on market discipline, but there was no market discipline, because when there is mania, when there are bubbles, and when there is excitement, and nobody is worried about the risk."
There was a reliance on internal risk management. But the previous CEO of Citi said, when the music is playing, you've got to dance.. so everybody is taking risks...So nobody's listening to the risk managers.
"And then there was a reliance on the rating agencies, that were being paid by the people they were supposed to rate. So the conflict of interest was huge. So we created a financial system that without proper rules and regulation, like the law of the jungle...you have periods of time when there is bubbles, there is manias, and then there is panic and fear. And you go from one to another, from boom to bust."
"That's why you need an appropriate system of regulation and supervision of banks, of hedge funds, of broker-dealers, of other financial institutions. Without it, its going to be a disaster. Excessive amounts of financial innovation, if not controlled and contained, is very risky..."
Charley Rose: "When did we last have a chance to avoid this?"
Roubini: "We missed the chance a few years ago...3 months ago, the damage was done. (July of 2008) Even a year ago, the damage was done. At this point, the mistakes were done a few years ago, you know, the feds cut rates. They kept them too low for too long, there was no supervision or regulation of toxic mortgages and other credit, the entire ideology was one of laissez-faire, so we really created the biggest bubble in the US housing market."
"And it was not just one of the sub-prime mortgage problem. The same kind of excess was in subprime, in near-prime, in prime, in home equity loans and in commercial real estate, credit cards, auto loans, student loans..leveraged loans that financed LBO's that should have never occurred, excessive borrowing by the state and municipal governments, the muni-bonds that have been thrattled, commercial loans, corporate bonds, all this creation of credit ...that is going to blow up right now."
"So we created a really huge mess, because we didn't properly regulate the financial system."
Charlie Rose: "Why this insight that you had...and why so few people?"
"I think I was right, because I've been studying financial crises for over two decades, I've written books about them, I was involved in policy making for a few years."
"...There are lots of good analysts on Wall Street, but there is all this bias of sell-side research. When your firm is underwriting stocks and bonds and securities, you can not be sticking your neck out and saying we're going to have a recession...So I think that many of the professional forecasters have this bias coming from their institution."
"And you don't have enough independent thinkers and scholars who are willing to speak the truth. But I was not the only one. Mark Schiller, and many other ones...about the housing bubble. I think some of the academics were out there realizing that this was a very severe risk."
"...You have to make sure that you separate the banks that are illiquid, but solvent, and that can be recapitalized, from those that are essentially insolvent, the sooner you shut them down, the better, otherwise they will take the deposits and make other risky loans, and it will be a disaster. That needs to be done. "
"On top of it, now we are going into a severe recession. Demand is falling, consumption by consumers is collapsing. Investment demand by corporation for new capital is also collapsing. And if the private sector is not going to spend, we need a major fiscal stimulus program, something on the order of 300 billion dollars."
"Roads, infrastructure, giving money to state and local governments, energy...otherwise, six months from now, we might try to rescue the financial system, but if the column is going to collapse, those delinquencies, those credit loses are going to mount, and therefore, anything we do to fix the financial system is going to be undone by a very severe recession. So we need to stimulate growth through fiscal expansion."
"The other problem is that the bad bank loans are also the debt of the housing sector, yet millions of house are now on the verge of bankruptcy..people at risk for losing their homes, being foreclosed."
"Therefore you have to reduce the face value of this debt. That was what was done during the Great Depression. We created the Home Owners Loan Corporation that bought all this bad assets from the banks, reduced the face value, and refinanced home owners into longer term fixed rate mortgages that they could afford."
"If we had don't avoid this tsunami of foreclosure, consumption is going to keep on falling, because people don't have money to spend, because they are buried under a mountain of debt, and the recession is going to become more severe. And these foreclosures are going to dump more homes on the market, and push down even further home prices."
"A third of all sales today are either foreclosures or short sales. So they are distress sales, not real sales. So we really have to do a lot more to prevent this financial crisis from becoming a more severe economic crisis."
Hundreds of thousands of angry and fearful French workers mounted nationwide strikes and protests Thursday to demand President Nicolas Sarkozy do far more to fight the economic crisis." (Associated Press 1/29/09)
"Spain has gone from creating more than a third of new jobs in the European Union to destroying more than 40,000 a week in past months -- more than France, Britain and Italy put together -- as the collapse of its housing boom coincides with the global crisis." Spain Bonds Signal More Pain; Yields Fail to Lure Axa (Update 2)(Anchalee Worrachate and Esteban Duarte, Bloomberg.com 1/29/09) "S&P cut Spain’s credit ranking one step to AA+ on Jan. 19, citing concern the budget deficit will balloon to 6.6 percent of gross domestic product this year, more than twice the European Union’s ceiling. The ratings company lowered Greece one level to A- five days earlier and Portugal to A+ on Jan. 21. "
Economic Sounds and Sightsis my on-line filing cabinet for resources and links related to our current economic crisis. (I am not an economist, and I do not belong to a political party.)In my quest to become a better-informed citizen, I know that I have much to learn. This blog is my way of sharing what I discover with others. I'd like to take this information to the next level, but I can't do this alone.
My vision? A collaborative multimedia, multi-modal interactive time-line might help us to understand the complex, interrelated factors and events more effectively. It would provide an opportunity for the inquisitive to view things from a broad perspective, and also explore things in rich detail. Ideally, the time-line would support multi-touch, multi-user interaction on larger displays and interactive whiteboards.